
Free Mock Test
Start Free UCEED Mock Test
Practice with a full-length timed mock and get instant results.
Shown below are three thematic population age-sex pyramids of three countries. The horizontal axis represents population in millions and the vertical axis represents age cohorts for both male and female population. Which of the following statements is/are correct?
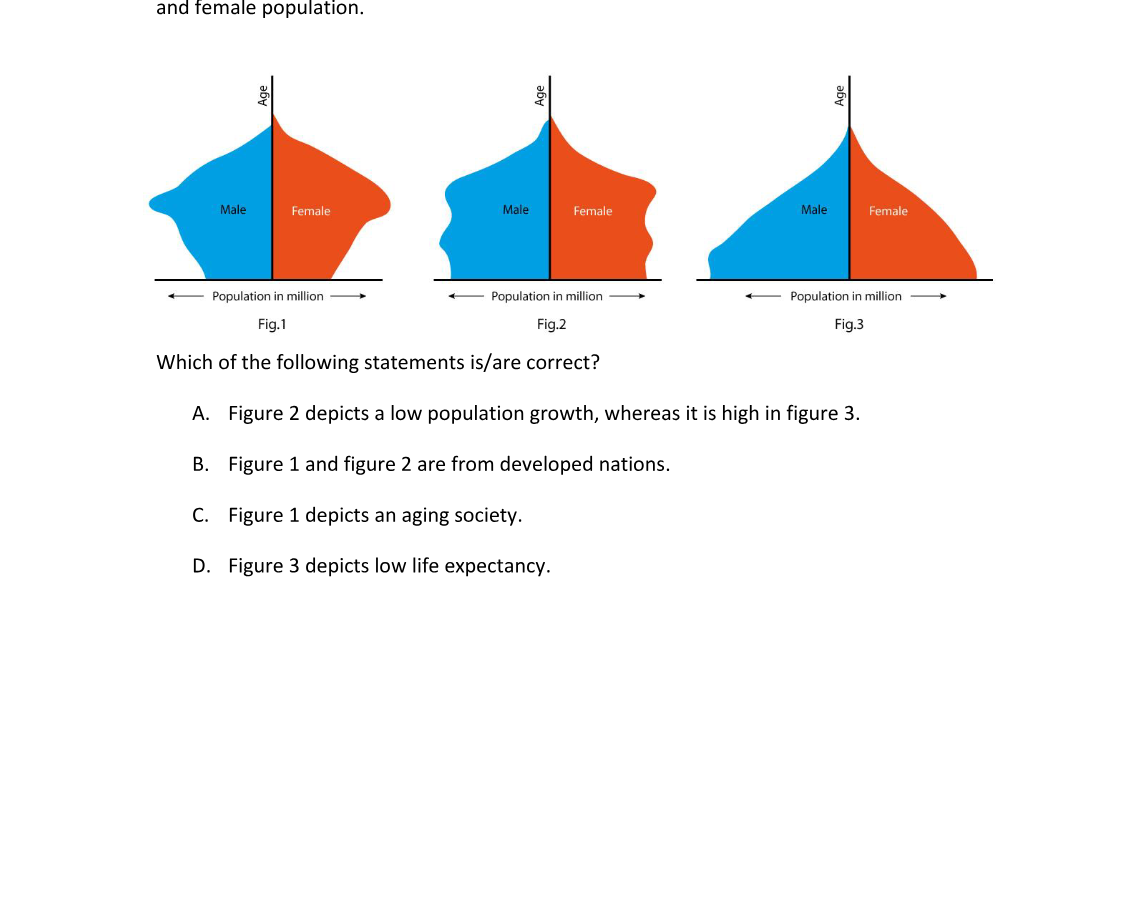 Diagram unavailable. Run
 npm run extract:bihar-cgl-2011-images or npm run extract:neet2025 to generate images.
Shown below are three thematic population age-sex pyramids of three countries. The horizontal axis represents population in millions and the vertical axis represents age cohorts for both male and female population. Which of the following statements is/are correct?
Diagram unavailable. Run npm run extract:bihar-cgl-2011-images or npm run extract:neet2025 to generate images.
Options
Correct Answer
A. Figure 2 depicts a low population growth, whereas it is high in figure 3.
- Exam
- UCEED
- Language
- English
- Year
- 2016
- Difficulty
- 1/5
- Section
- Multiple Select Questions (MSQ)
Related Questions
[50 Marks] Mandatory question Drawing Krishna, an 8-year-old boy, is taking his pet dog – Scooby, for a walk in a park.…
What is the main purpose for the presence of water in a toilet bowl (Western Commode/ Water Closet)?
A lever mechanism has Effort (E), Fulcrum (F) and Load (L). For example, a pair of scissors will have an order ‘EFL’ as…
Shown below is a traditional metal artefact made using the lost-wax casting technique. What is this craft called?
Shown below are the key frames of a bird flying. Which of the following options is the correct order?
Shown below are letters ‘e’ taken from four popular logos, arranged in a sequence. Which of the options is the correct…
What is the total number of musical instruments in the image below?
P is a transparent glass filled with water as shown below. Q is a white cylinder with parallel lines printed around it.…
The following image shows a set of letters in different fonts. Which of the options is the word formed by letters of th…
The following images show cave paintings from India. Which of the options is correct?
Related Pages
Complete Test Series
Unlock Complete UCEED Test Series
Get all PYQs, mock tests, and detailed analytics in one package.